

Answers to all key business questions:
How is the offer you launched yesterday performing?
Which promotional code is performing the best?
Which markets are generating the most demand?
Which markets are leading in reservations?
How far in advance are they booking?
Which duration, board type, room type generates the most reservations?
To quickly address these and many other important questions for your business, we have developed the best and most comprehensive reporting and dashboard solution: Mirai BI.
Data available on Mirai BI
- Daily demand (detailed by stay dates, duration, markets, guests...) and the associated availability. It allows a good understanding of the current situation and optimising the commercial strategy to make the most of it.
- Advertising investment.
- Sales and ROI of online marketing campaigns.
- Reservations with all their details.
Stay dates, duration, lead time, ADR, adults, children, total booking value, booking origin (market), status, rate, offer, promo code, Room Type, occupancy, Board Basis, Club, Extras, etc.
This enables a multitude of interesting analyses. To begin, access the BI section within your Mirai extranet.

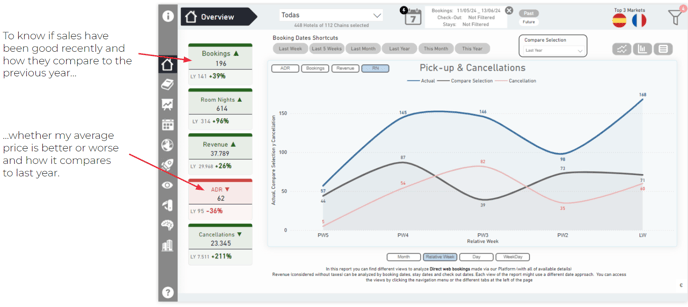
Overview. Home
A first photo displaying the key KPIs, allowing you to easily and intuitively track the evolution of your sales in recent weeks.
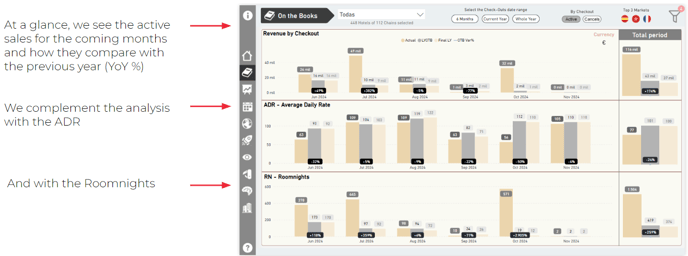
On the Books for any future date
How do the upcoming months look?
Booking activity translates into profitable occupancy and it is crucial to be able to analyse future months of stay, comparing them to the situation of the same period last year or to the closed month.
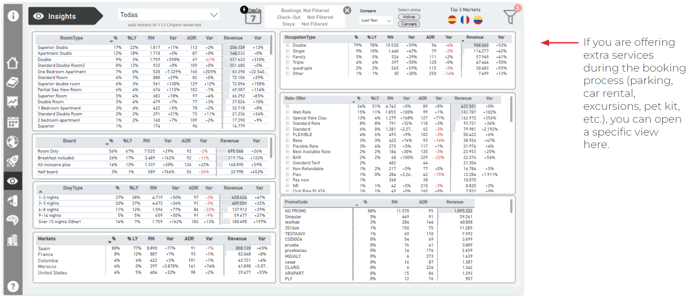
Actions that contribute the most to your direct sales. Insights
In this view, you can find answers to questions such as: How well is the promo code I launched on social media working? What is the best-selling board on my website? Is it time to modify the Junior Suite supplement?
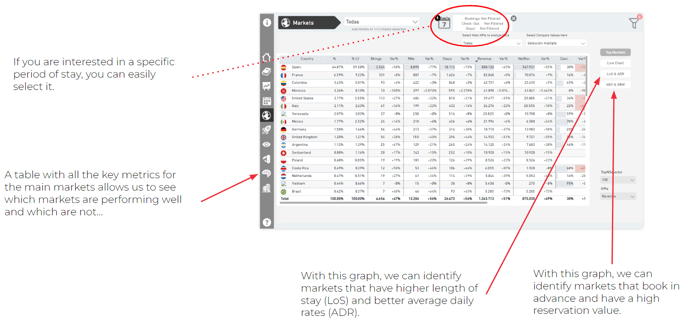
Which markets are currently performing well, and which ones offer interesting potential?
To analyse specific booking periods in which we have carried out special actions and see how they have performed.
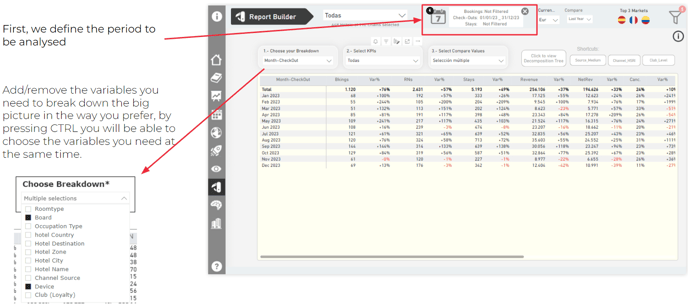
Reality is complex: breaking down the "elephant" into pieces.
With rich data full of variables, designing views that cover all possible approaches is very challenging. That's why we have a "Swiss army knife" that allows breaking down reality according to the user's preference.
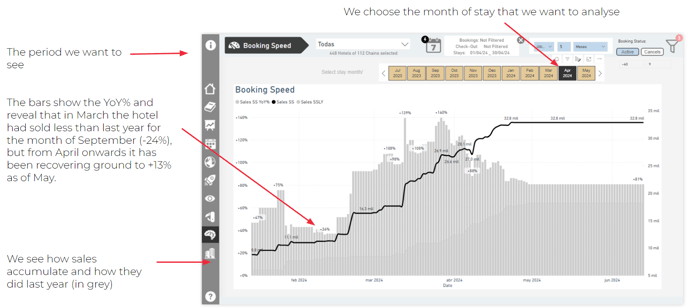
September is still slow... What is the booking pace?
Observing how the booking curve is developing for the month we choose and comparing it with the previous year quickly illustrates whether the trend is positive and allows us to start predicting.
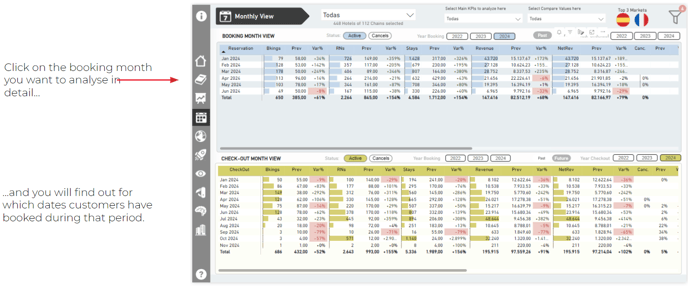
When do my clients book for? Here are all the details.
This screen allows you to analyze at a glance how your sales are going, both by month of issue and by month of stay. You will find all the ratios you need here, and it also allows you to cross-reference both tables.
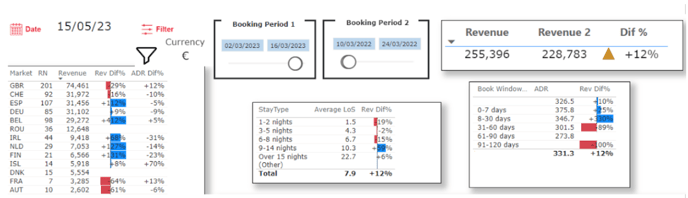
... and all of this comparing with the previous year, previous month, previous week, or any period you wish to compare it with.
Ideal for analysing periods as important as Easter Week or the Black Friday campaign.
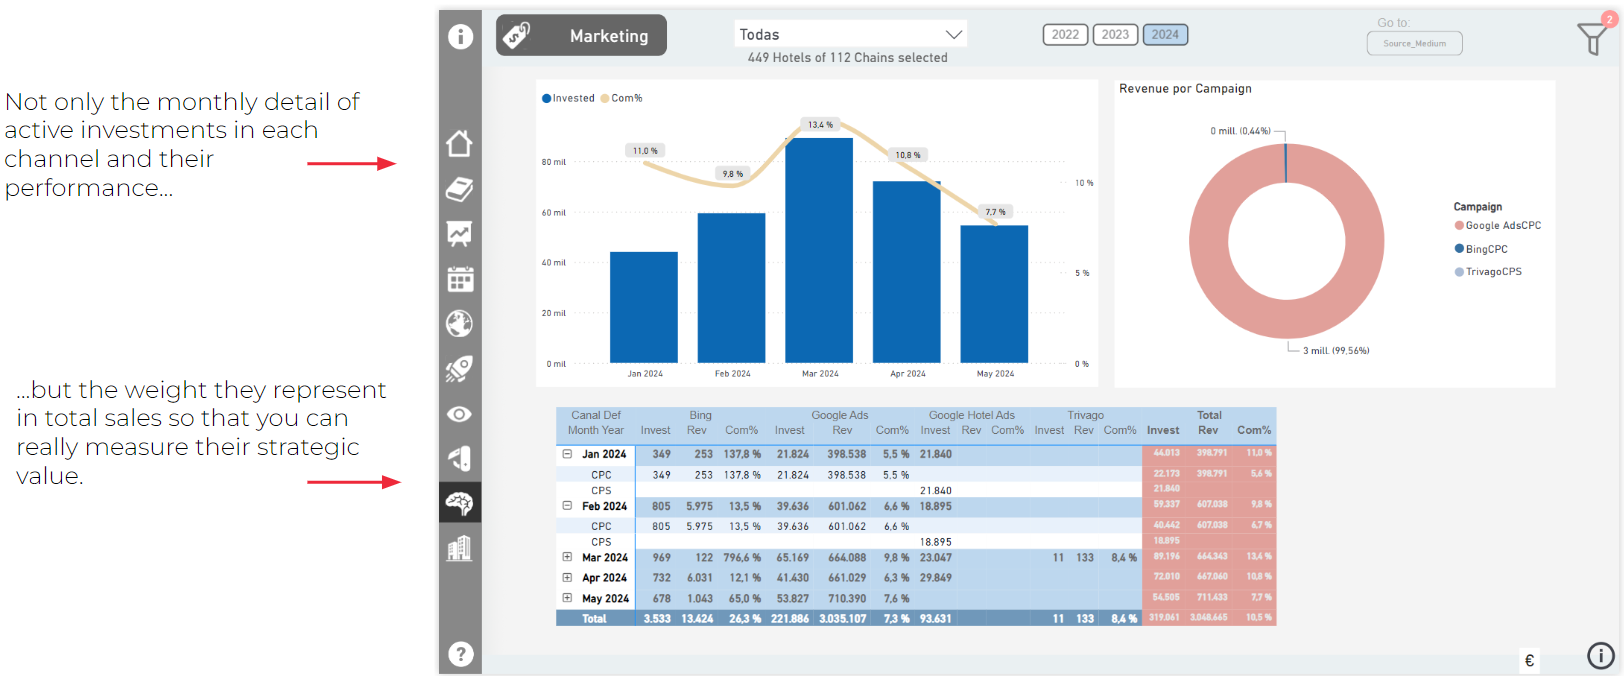
Where do customers find me?
Digital marketing is one of the keys to success.
Do I have prices under control?
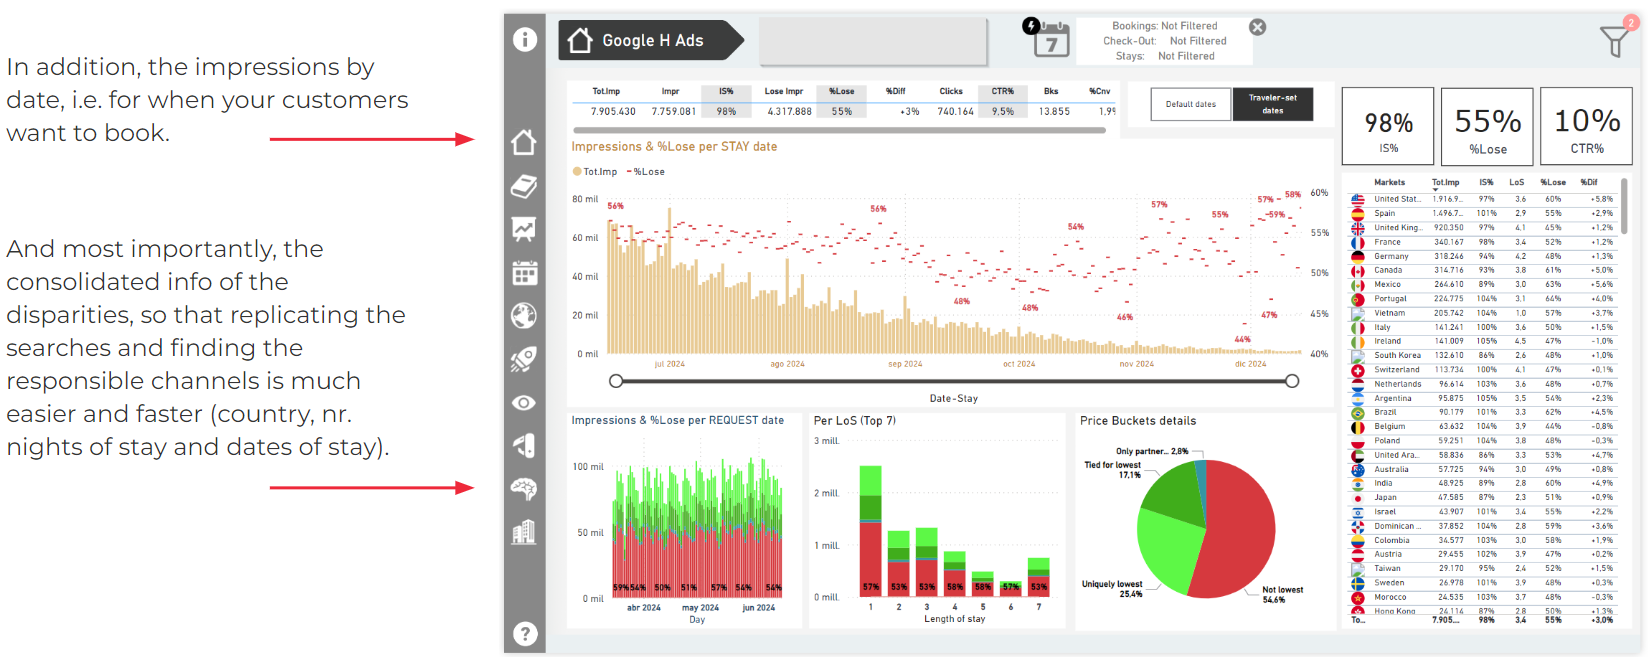
Google has the answer, and our BI shows it to you clearly and simply.
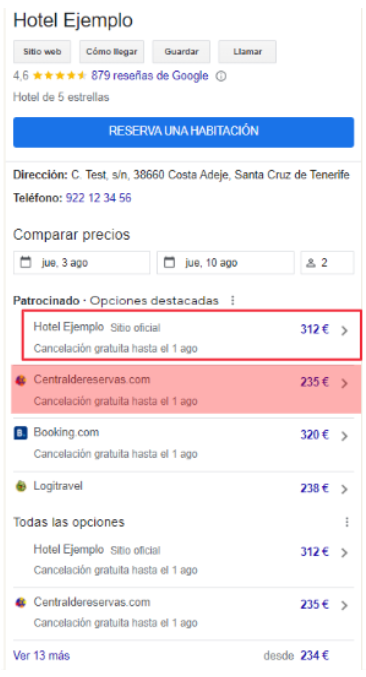
Google's metasearch engine offers us (and your customers too) the prices from most online portals, showing the disparities they create, diverting sales to other channels, and eventually to other establishments.
To take action, it is necessary to have an objective data, which can only be obtained by conducting numerous searches, as the results vary by:
- stay date
- country
- number of people accommodated...
In Business Intelligence, you can find the aggregated data of ALL searches made by real users on the Google platform, allowing you to analyse the Impression Share, the % coverage of your campaigns in Google Hotel Ads, the Lose, the % of searches where your website did not show the best price, the CTR, the % of times customers clicked on website prices, and, of course, the number of bookings made through these campaigns.
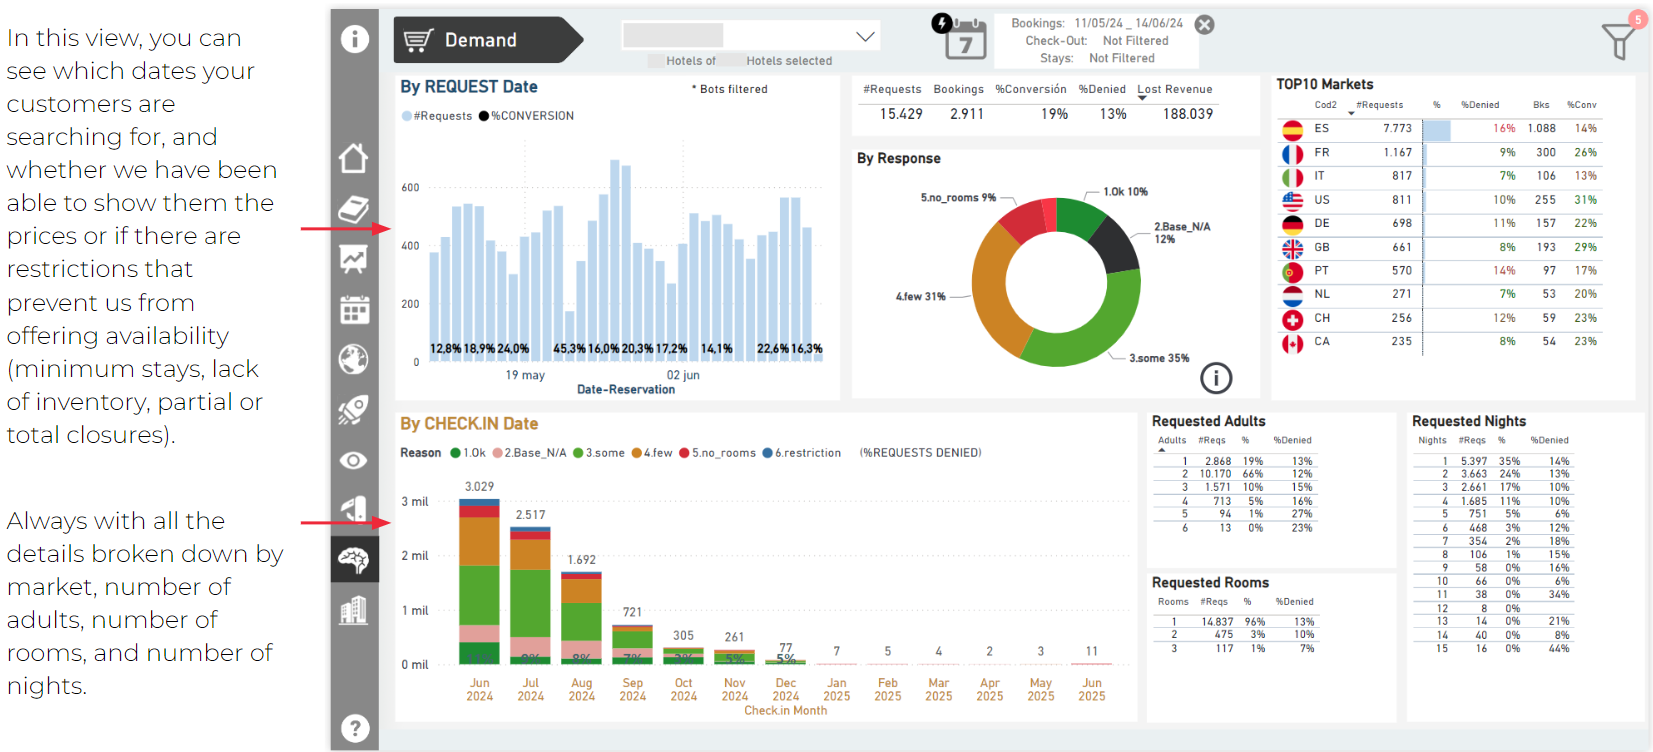
What is the actual demand on your website?
Find out if there are dates when customers want to book and cannot.
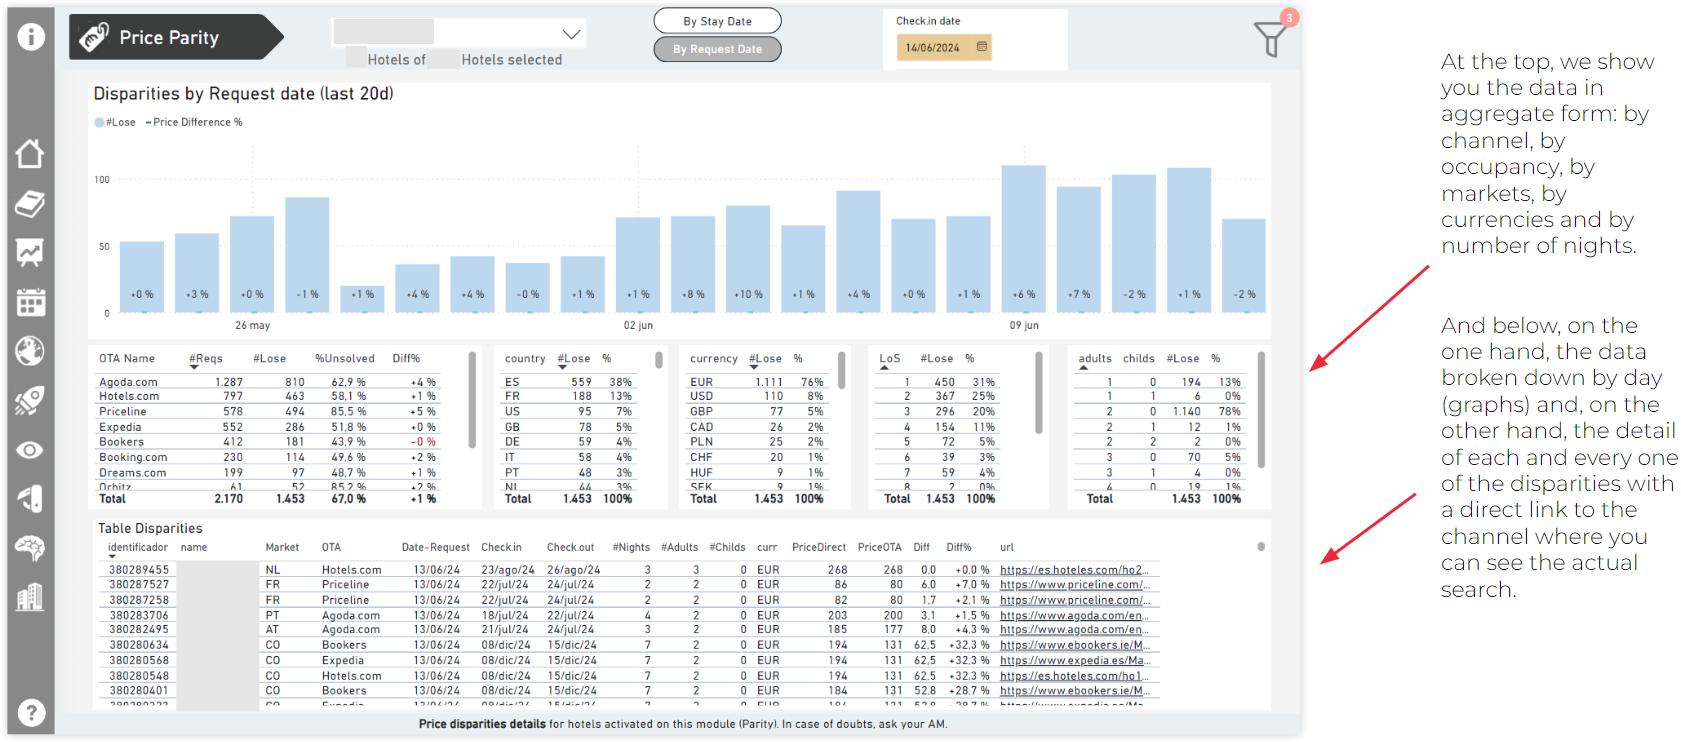
Parity
Another step towards controlling disparities
If you have activated our price comparison tool, we will show you ALL of its data.
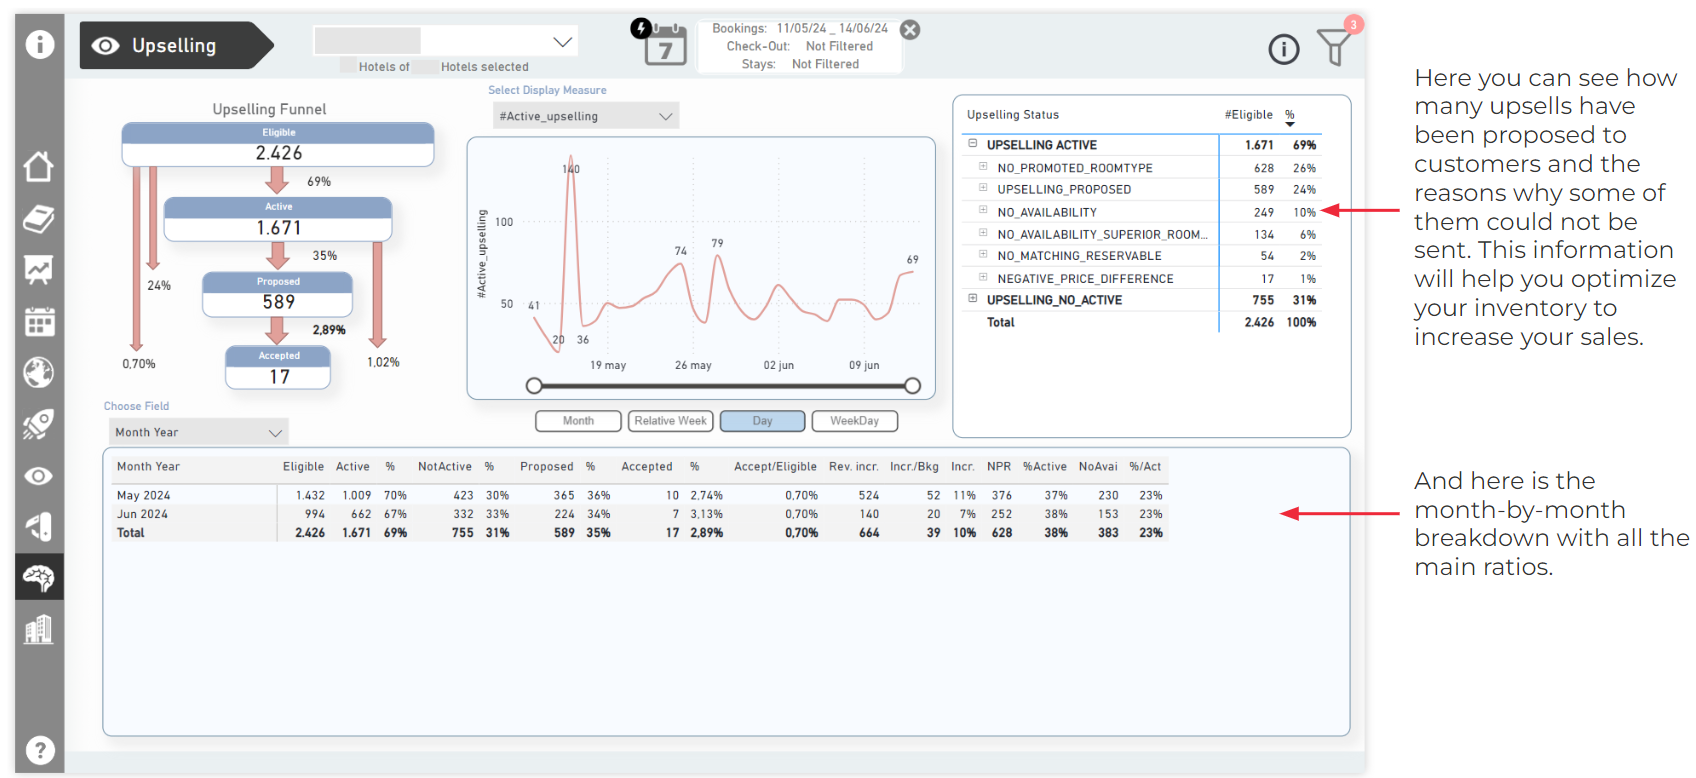
Upselling
Your ally to increase your income effortlessly.
All the metrics you need to analyse the complete picture:
ADR - Average Daily Rate (average daily price per room, excluding taxes)
ABV - Average Booking Value (average total booking value)
ABW - Average Booking Window (average booking lead time, in days)
Bookings - Number of Reservations
Stays - Each person-night counts as 1 stay, excluding babies (people - night, including adults and children but excluding babies)
LoS - Length of Stay (average length of stay)
Nights - Number of nights booked. Equivalent to LoS for one booking, and for multiple bookings, sum the nights of each booking
Prod - Production (sales reviewed - deducting no-shows - with past stay. Future cancellations are deducted)
Rooms/Bkg - Average number of rooms per booking
RN - Room Nights. Calculated by multiplying the number of rooms by the nights stayed for each booking.
Sales - Total value of bookings in the hotel currency without taxes.
Extra Sales – Sales amount for extras (not rooms) in the hotel currency without taxes. (valor de las ventas de Extras sin impuestos)
Mob % – Mobile % of total